News
Ella Necheles (left), A.B. ’21, an environmental science and engineering and applied math concentrator, and Rachel Collins, A.B. ’20, an earth and planetary science concentrator, set up a mini "hurricane" during an ES 129 lab. (Photo by Eliza Grinnell/SEAS Communications)
At its height, Hurricane Dorian and its brutal, 185-mile-per-hour winds stretched more than 60,000 square miles, whipping an area of the Atlantic Ocean roughly the size of Georgia.
By comparison, the hurricane forming in front of Rachel Collins could fit comfortably inside a shoebox.
Standing safely on dry land inside a Harvard classroom, she was using a pump, tank, turntable, and tap water to “build” a miniature hurricane as a way to learn about the pressure gradient and Coriolis effect that characterize these devastating storms.
“Sometimes, when you just look at the math and the derivatives, it is hard to conceptualize how these things are related to the storms you see on TV,” said Collins, A.B. ’20, an earth and planetary science concentrator. “Seeing the physics in action like this makes it easier to understand.”
Using hands-on lab work to help students understand the physics of weather and fundamentals of climate is the centerpiece of Climate and Atmospheric Physics Laboratory (ESE 129), a new course at the Harvard John A. Paulson School of Engineering and Applied Sciences.
Taught by Marianna Linz, Assistant Professor of Environmental Science and Engineering and of Earth and Planetary Sciences, the course’s flipped classroom model challenges students to complete readings and problem sets independently and then tackle in-class synthesis assignments and labs that bring concepts to life.
“Essentially, we are studying fluids on a rotating planet. Rotating fluids are super-weird, incredibly non-intuitive, and extremely beautiful,” Linz said. “Weather systems develop because the earth is rotating, and you can get an analog for a rotating fluid system by using a tank that is rotating on a table. You can learn a ton of lessons from that, in terms of gaining intuition into how the atmosphere actually works.”
As their hurricane continued churning in the tank, Collins and lab mate Ella Necheles, A.B. ’21, an environmental science and engineering and applied math concentrator, began dropping tiny paper flecks into the water, keeping a careful eye on how their movement patterns changed as they approached the higher-pressure eye-wall of the hurricane.
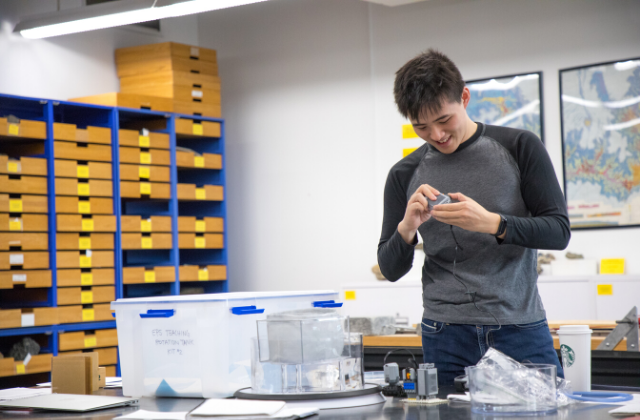
Miles Wang, S.B. ’20, an electrical engineering concentrator, works through a lab assignment for ESE 129. (Photo by Eliza Grinnell/SEAS Communications)
They and their classmates experimented by angling the lab set ups, pouring pebbles into tanks to create more drag, or introducing temporary disturbances into the systems.
“It was fun to see how manipulating the factors influenced the shape or behavior of the drain. I also found this part really helpful in understanding how the different components, specifically height and pressure, related to the dynamics we were seeing,” Necheles said. “After seeing how we could relate the rotation speed to the pressure gradient, things really started to click.”
The hurricane lab was one of several hands-on sessions designed to help students grasp concepts that are difficult to explain with words and diagrams, Linz said. In another lab, students dropped a column of ice into the middle of water tanks to see how the earth’s cold poles and warm equator impact global circulation.
The course, which covers concepts in global warming, the greenhouse effect, weather systems, global circulation, and waves in the atmosphere, also focuses on modeling and data visualizations.
“It’s not something we talk about before we start doing research, but the plots in my first paper were terrible,” Linz said. “You learn so much over time, but I don’t think it is necessary to learn from doing it badly and having it published. The ability to think about how to visualize data will be relevant for STEM majors no matter where they go.”
The opportunity to develop better data visualization skills inspired Miles Wang to take ESE 129. While it has been challenging to grasp some of the complex equations, he has enjoyed the coding exercises, especially since he plans to pursue a data science career.
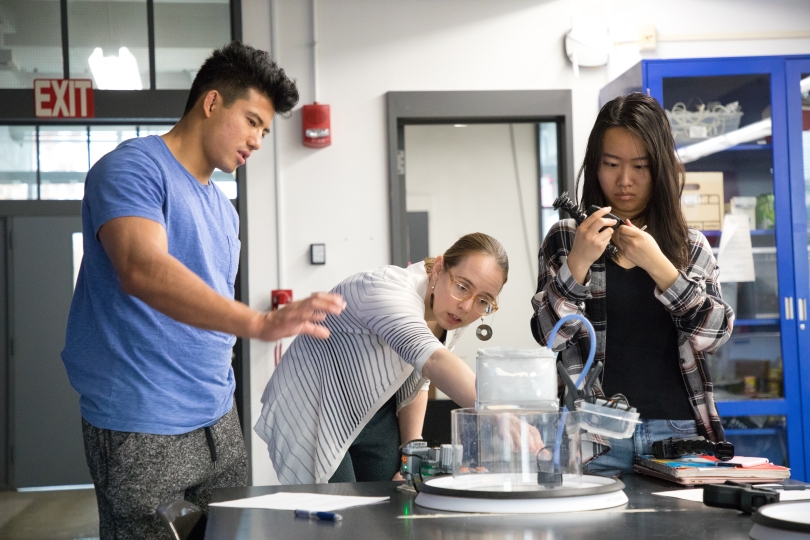
Linz helps Cliff Wang, A.B. '21, a chemical and physical biology concentrator, and Wendy Wu, A.B. '22, an environmental science and engineering concentrator, set up their tank. (Photo by Eliza Grinnell/SEAS Communications)
“The most poignant lesson I’ve learned so far is how the same data can be presented in vastly different ways to tell contradicting stories or messages,” said Wang, S.B. ’20, an electrical engineering concentrator. “For example, there was a data visualization that took real data to show that global warming wasn’t a real phenomenon. But we were able to understand what tools were used to make it look like it wasn’t real.”
For Wendy Wu, the weekly labs made ESE 129 an appealing change from lecture-style courses. She particularly enjoyed a field trip to a glass blowing studio, where students created paperweights to better understand the concept of black-body radiation (the energy emitted by all objects based on their temperature).
The reflectivity and absorptivity of glass varies greatly depending on its color, and students saw these differences “in action” as they heated and cooled the glass.
“The most surprising lesson I’ve learned has been the science behind precipitation and how difficult it is to predict precipitation,” said Wu, A.B. ’22, an environmental science and engineering concentrator. “By being able to examine different predictive models, I was able to better understand and sympathize with the unpredictability of weather forecasts.”
Having the ability to read a weather map and understand how the jet stream affects extreme weather events will help students be more informed citizens in a future that will be increasingly impacted by climate change, Linz said.
“I think it is important for everyone to understand global warming and climate from some perspective, whether that be physics or ethics,” she said.
Cutting-edge science delivered direct to your inbox.
Join the Harvard SEAS mailing list.
Press Contact
Adam Zewe | 617-496-5878 | azewe@seas.harvard.edu


