News
So, the climate is getting warmer. Who cares?
Climate change has a PR problem in America.
For decades, we called it ‘global warming,’ an innocuous-sounding phrase invoking a gentle increase in worldwide temperatures, like turning up the thermostat in a house.
“People asked, so the climate is getting warmer. Who cares?” said Michael B. McElroy, the Gilbert Butler Professor of Environmental Studies at Harvard University. “And scientists are partly to blame for that because of how we’ve described climate change.”
It’s been difficult to get Americans worried about a 1-degree increase in temperature over a 100-year period, especially when most of the images associated with global warming — crumbling ice sheets or a lonely polar bear padding across a melted landscape — feel so distant.
But climate change is here. Mitigating the effects of global warming — better described as irreversible changes to the climate structure — is about more than saving the planet in the longer term; it’s about saving human lives in the near term.
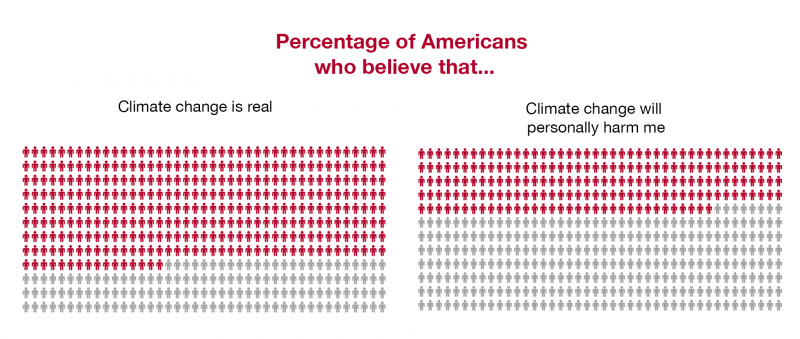
From severe storms and catastrophic flooding to record-breaking droughts and deadly wildfires, Americans are living with the consequences of a changing climate every day. Still, the majority of Americans did not believe climate change would harm them personally, according to a Yale University study. That connection — between climate change and human health — has been, in large part, missing from public conversations and political debate in America today.
Howe, Peter D., Matto Mildenberger, Jennifer R. Marlon, and Anthony Leiserowitz (2015). “Geographic variation in opinions on climate change at state and local scales in the USA.” Nature Climate Change, doi:10.1038/nclimate2583
Researchers at the Harvard John A. Paulson School of Engineering and Applied Sciences (SEAS) are exploring that connection between human health and a changing climate. Among their findings: In Pennsylvania, days with dangerously high surface ozone levels could increase by 100 percent in the coming decades, increasing the risk of asthma and other respiratory diseases in children. Wildfires in Washington could choke densely populated areas for days with thick, harmful smoke. Severe storms in Texas, Oklahoma, Nebraska, Iowa, the Dakotas and adjoining states could deplete protective ozone in the stratosphere, exposing humans, livestock and crops to harmful ultraviolet radiation.
The Eastern U.S.: The heat is rising
If the world were to cut all of its carbon emissions tomorrow, temperatures have already risen enough to cause more severe and prolonged heat waves. Extreme heat has serious impact on human health. Depending on humidity levels, prolonged exposure to 100-plus degree days can lead to heat stroke and dehydration, as well as cardiovascular, respiratory, and cerebrovascular diseases.
In the past decade, extreme heat waves in the U.S. have killed hundreds of people, mostly elderly and poor in urban areas, and cost tens of billions in damage. Northern cities, such as Chicago, New York, Philadelphia and Boston, which are less prepared to deal with excessive temperatures, will likely face the brunt of the public health burden of heat waves in coming years.
With little ability to stop future heat waves, the best option to mitigate damage is preparation. Improving our ability to accurately predict heat waves can save lives.
Most current models cannot forecast beyond about 10 days and seasonal models have limited ability to predict extreme events. In 2012, for example, the National Weather Service’s Climate Prediction Center forecasted normal summer temperatures in the Northeast and Midwest U.S. Instead, the regions experienced three separate, record-breaking heat events in June and July that resulted in more than 100 deaths.
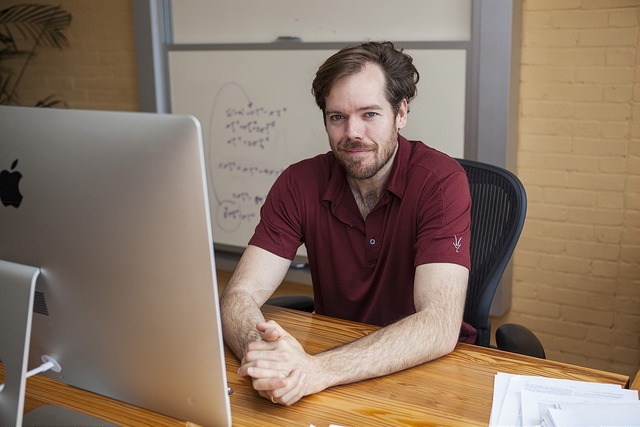
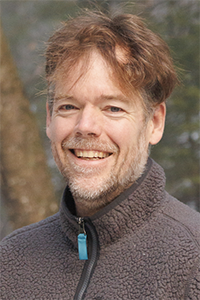
Peter Huybers, professor of earth and planetary sciences and of environmental science and engineering (Photo courtesy of Eliza Grinnell)
Peter Huybers, Professor of Earth and Planetary Sciences in the Department of Earth and Planetary Sciences and of Environmental Science and Engineering at SEAS, is working to understand and predict these deadly temperature spikes. Huybers and his lab identified sea surface temperature patterns that can predict increased odds of extreme heat waves in the eastern U.S. up to 50 days in advance. Those patterns — like a fingerprint on the surface of the Pacific Ocean — consistently precede heat waves in the eastern U.S.
The Huybers team found that lack of precipitation, which is known to contribute to heat waves, is also associated with this finger print — known as the Pacific Extreme Pattern. While it does not guarantee that a heat wave will strike, seeing this pattern significantly increases the odds of one happening.
“Our technique was able to predict previous heat waves, including the deadly heat waves of 2012, and was skillful when applied to earlier events between 1950 and 1980,” said Huybers. “However, the technique doesn’t predict the Dust Bowl years of the 1930s, reminding us that other environmental factors must also be important.”
Huybers and his colleagues are continuing to research this connection, pushing the horizon on predicting summer heat waves in the eastern U.S.
With more time to prepare, utility companies could ensure they have enough power options to deal with a spike in demand; farmers could alter irrigation tactics to prevent crop loss; city planners could set up cooling spaces for the elderly or those without air conditioners and step up programs to track homeless people and homebound, chronically ill older Americans.
As the air warms due to global climate change, Northeastern urban and suburban areas could also see an increase in ground level ozone — the nasty chemical compound that makes up the majority of smog, especially in summer.
Ground level ozone is created by chemical reactions involving oxides of nitrogen (NOx), volatile organic compounds (VOCs) and sunlight. Factories, power plants and cars produce most of the NOx in the U.S.
Ozone is well known to cause serious respiratory illness and is especially dangerous for children, seniors, and people suffering from asthma.
“Even short-term exposure to ozone over a few hours or days has been linked to serious health effects,” said Loretta J. Mickley, Senior Research Fellow in Chemistry-Climate Interactions in the Atmospheric Chemistry Modeling Group. “High levels of ozone can exacerbate chronic lung disease and increase death rates.”
It’s easy to feel helpless and overwhelmed in the face of global climate change but legislative action can make a difference when it comes to the environment. Elsie Sunderland, the Thomas D. Cabot Associate Professor of Environmental Science and Engineering, found that regulations requiring the reduction of mercury emissions had a larger impact on the environment than researchers previously thought. Between 1990 and 2010, global mercury emissions from manmade sources declined 30 percent. The reduction in atmospheric mercury was most pronounced over North America, where mercury had been gradually phased out of many commercial products and controls were put in place on coal-fired power plants that removed naturally occurring mercury from the coal being burned.
Researchers have long known that temperature and ozone are linked — the hotter the temperature, the higher the ozone levels. However, researchers have also established that if the temperatures rise above the mid-90s Fahrenheit, this relationship can break down. So, the question is: how will rising global temperatures impact the severity and frequency of days with dangerously high levels of ground ozone, known as ozone episodes?
Mickley and her team are unraveling the complex relationship between ozone and rising temperatures in the U.S.
In 2016, graduate student Lu Shen and Mickley found that if local and global emissions continue unchecked and temperatures rise as projected, the U.S. could see a 70- to 100-percent increase in dangerous ozone episodes, depending on the region.
The Northeast, California and parts of the Southwest, would be most affected, experiencing up to nine additional days per year of unhealthy ozone levels in the next 50 years. The rest of the country could experience up to three additional days of unhealthy ozone.
What does that mean for health in the U.S.? Hospital admissions and emergency department visits would increase, cases of chronic respiratory conditions, such as asthma and chronic bronchitis, would increase, and more people could die from respiratory illness.
“We need ambitious emissions controls to offset the potential of more than a week of additional days with unhealthy ozone levels,” said Mickley.
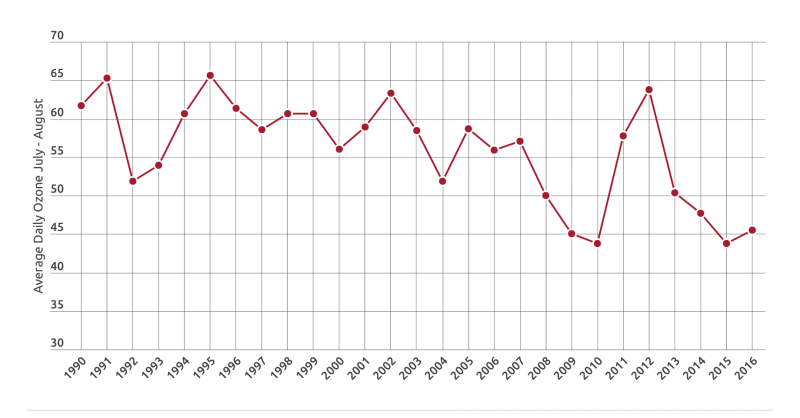
The good news is, we’ve already seen the powerful effect regulation has on ozone levels in the U.S. Between 1990 and 2016, ozone levels decreased significantly, especially on the east coast, thanks to the Clean Air Act and its amendments, which targeted ozone precursors.
The bad news is that high temperatures can upend that trend.
The graph shows 15 years of surface ozone measurements in Madison County, Illinois. Since 1990, ozone decreased over time due to the powerful Clean Air Act and its amendments, which reduced emissions of ozone precursors. But very hot temperatures — as seen in 2012 — buck that trend. A similar pattern was seen at measuring sites across the country. A full, interactive map is available here.
Mickley and her team are also developing tools to predict when and where Americans are most at risk for increased levels of ozone in the short-term.
The researchers found that high levels of summertime ozone in the Eastern U.S. are correlated with large-scale meteorological patterns in the spring, including sea surface temperatures. The team used this relationship to predict average summertime ozone levels one season in advance.
“A prediction tool could act as an early warning system to communities most at risk for high-ozone days,” said Mickley. “Local communities could mobilize resources and plan protocols to help its most at-risk citizens, including children and seniors, during episodes in the upcoming ozone season. Such protocols could include advisories for people to stay indoors.”
Brewing storms in the Midwest
As temperatures increase and more water vapor evaporates into the atmosphere, storms will become more frequent and more intense — especially in the Midwest.
Flooding and damage associated with these storms is a threat to the lives and livelihood of the 60 million people living in the Midwestern states, especially farmers who rely on predictable rainfall patterns. But the intensity of these storms, combined with factors unique to the Great Plains region, may also damage the protective ozone layer that shields life on Earth from harmful ultraviolet radiation.
James G. Anderson, the Philip S. Weld Professor of Atmospheric Chemistry at SEAS and the Department of Earth and Planetary Sciences, is studying this phenomena. In 2012, his team discovered that during intense summer storms over the Midwest, water vapor from these storms is injected deep into the stratosphere. By studying ozone loss over the Arctic in winter, Anderson and his collaborators established that combinations of both temperature and water vapor convert stable forms of chlorine and bromine into free radicals capable of transforming ozone molecules into oxygen, implicating storm-injected water vapor in the loss of ozone over the U.S. in summer.
By using advanced radar techniques, Anderson and his team, including researchers at Texas A&M and the University of Oklahoma, recently found that thousands of storms each summer penetrate the stratosphere to provide fuel for these reactions — far more than previously thought.
“Rather than large, continental scale ozone loss that occurs over the polar regions in winter, these radar observations and our new high accuracy, high spatial resolution temperature measurements found that the structure of ozone loss in the central U.S. is highly localized over numerous regions,” said Anderson.
These reactions, depending on the temperature of the stratosphere, could trigger a 12- to 17-percent decrease in ozone in the lower stratosphere one week after a storm. This corresponds to a 2- to 3-percent decrease in stratospheric ozone in the region of enhanced water vapor. Even a 1-percent decrease in stratospheric ozone can lead to a 3-percent increase in skin cancer in humans – there are three and a half million new cases of skin cancer diagnosed each year in the U.S. alone. Since ultraviolet radiation also impairs the molecular chemistry of photosynthesis, such a change could also have a major effect on agriculture in the Midwest.
“This isn’t about just human health, this is about crop yields, livestock, and the ability to function for extended periods outside in the summer,” said Anderson.
Anderson and his lab are developing new platforms to observe this phenomena in action. Central to that effort is a research platform called the StratoCruiser, a super-pressure balloon designed to collect data at an average of 75,000 feet — well into the stratosphere.
Powered by an array of solar cells, the StratoCruiser will fly above the central U.S. for four to six weeks, collecting data on how water vapor injected into the stratosphere alters the properties of particles and initiates the series of chemical reactions that destroy ozone.
Anderson and his team are developing sensing instruments sturdy enough to withstand winds and rain from intense convective storms yet lightweight enough to allow the instrument package, suspended on a Kevlar filament below the balloon, to sample air between 40,000ft and 75,000ft.
The instruments have to work at temperatures ranging from minus 120 degrees to plus 90 degrees Fahrenheit, withstand the low pressure of the upper atmosphere, power themselves and operate autonomously for the six-week mission.
SEAS undergraduates in Anderson’s Engineering Problem Solving and Design Project (ES 96) are playing an important role in solving these design challenges. The student team who designed a spectrometer that measures hydrochloric acid (HCl) in the atmosphere was awarded $200,000 from NASA’s Undergraduate Student Instrument Project grant. The new instrument will be launched by NASA fall 2017 from Ft. Sumner, New Mexico.
Another ES 96 project for undergraduates involves designing and building a new class of instruments to measure free radicals and other reactive species from solar powered stratospheric aircraft. These instruments, which will collect data over the U.S. continuously for three months, will provide the ability to forecast the amount of UV radiation projected for specific regions of the Great Plains states in summer. The solar powered stratospheric aircraft can also circumnavigate the globe to obtain observations related to the response of the climate structure to increasing levels of carbon dioxide and methane.
One of the biggest questions Anderson and others want to answer is whether or not the process of ozone depletion is reversible.
Anderson knows how well-communicated science can spur action on climate change. It was his research in the late 1980s that finally proved the link between chlorofluorocarbons (CFCs) from aerosol cans, air conditioners and refrigerators and the Antarctic ozone hole. The discovery was the key step towards public acceptance of the connection, which ultimately led to the phase-out of CFCs under 197-country Montreal Protocol signed in 1987.
“We saw the power of regulation and legislation when global powers got together and decided to ban CFCs,” said Anderson. “After that, we thought we’d solved the problem of ozone depletion. Now, it could be made much worse than we thought by climate change. If we continue on this course, decreases in ozone and associated increases in UV dosage could be irreversible.”
The West is burning
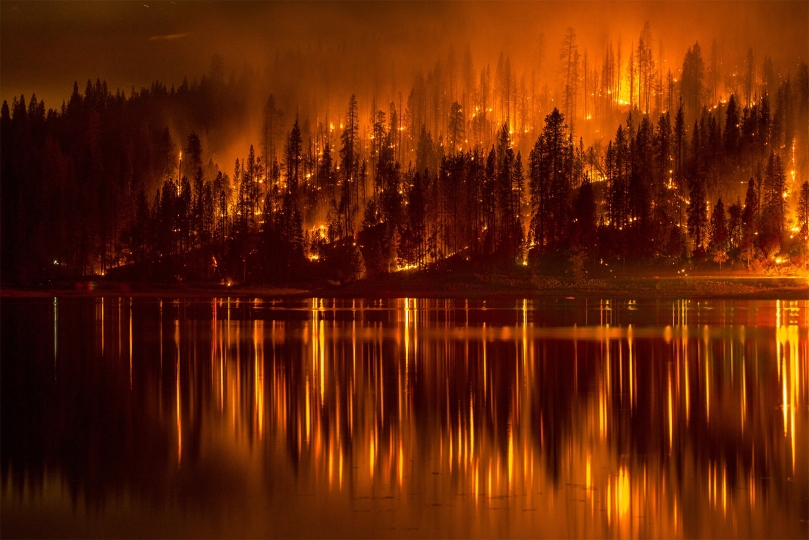
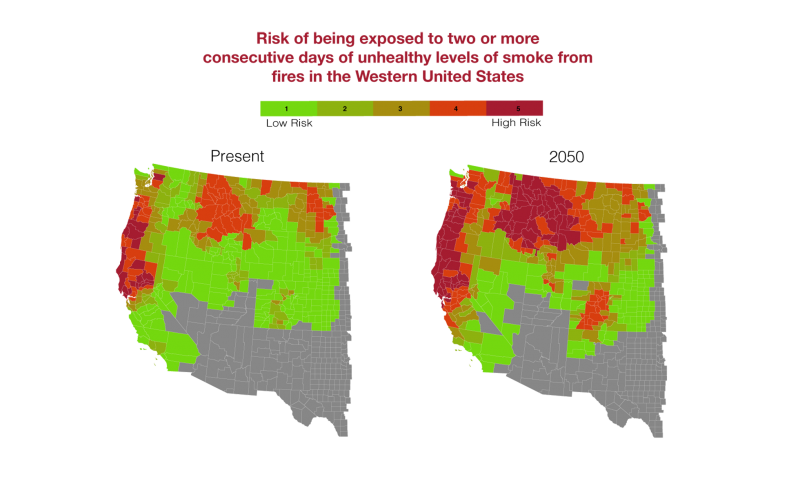
In 2016 alone, more than 67,000 wildfires burned over 5.5 million acres in the U.S., an area equivalent to the size of New Jersey. If global warming continues on pace, the models predict that by 2050 the wildfire season in the western U.S. will be about three weeks longer, twice as smoky, and will burn more area. In the coming decades, the area burned in August could increase by 65 percent in the Pacific Northwest; could nearly double in the Eastern Rocky Mountains/Great Plains; and quadruple in the Rocky Mountains Forest region.
Liu, JC, LJ Mickley, MP Sulprizio, X Yue, K Ebisu, GB Anderson, R Khan, ML Bell, M Bravo, and F. Dominici. 2016. Particulate Air Pollution from Wildfires in the Western US under climate change. Climatic Change. 138 (3): 655-666. View the interactive map here.
But wildfires threaten more than land and homes. The smoke they produce contains particles that can contaminate the air hundreds of miles away. As wildfires increase in frequency and intensity, more and more communities are at risk of prolonged exposure to harmful levels of smoke, including heavily populated areas such as California’s San Francisco, Alameda, and Contra Costa counties, and King County in Washington.
Mickley and the Atmospheric Chemistry Modeling Group are developing tools to predict how wildfires will impact air quality. The work is part of a collaboration with Yale University.
Between 2004 and 2009, about 57 million people in the western U.S. experienced a smoke wave, a term Mickley and her colleagues coined to describe two or more consecutive days of unhealthy levels of smoke from fires. Between 2046 and 2051, the team estimated more than 82 million people are likely to be affected by smoke waves, mostly in Northern California, Western Oregon and the Great Plains, where fire fuel is plentiful.
Loretta J. Mickley, Senior Research Fellow in Chemistry-Climate Interactions (Eliza Grinnell/SEAS)
All across the western U.S., climate change will likely cause smoke waves to be longer, more intense, and more frequent. About 13 million more children and seniors — who are at higher risk for respiratory illness — will be affected by smoke waves compared with the present day.
Mickley and her team have developed a model to predict, at the county level, areas most at risk for smoke waves. The model would allow local governments or the U.S. Forest Service to prioritize these areas in fire mitigation efforts such as clearing out dry underbrush or performing controlled burns.
“No matter what ignites a wildfire, whether by lightning or human carelessness, the spread of a fire is determined by the availability of dry, easily combustible fuel,” said Mickley. “We’re currently seeing and we will continue to see in future decades, warmer temperatures increase the supply of such fuel. The massive fires of 2016 are likely an indication of what’s to come.”
For nearly 20 years, the GEOS-Chem global transport model has provided hundreds of research groups around the world insight into the chemical composition of the atmosphere and how it is being impacted by human activity. Developed by Daniel Jacob, the Vasco McCoy Family Professor of Atmospheric Chemistry and Environmental Engineering at SEAS and the Department of Earth and Planetary Sciences, and housed at Harvard University, the open source model is an international standard for modeling pollution. Since its inception, the model has been used to understand the global biogeochemical cycling of mercury; the intercontinental transport of air pollution, which is critical to EPA’s setting of air quality standards; and has added considerably to the knowledge of worldwide emissions of pollutants and climate gases.
Pollution knows no borders
It’s not just the continental U.S. that is facing health consequences from global climate change. Alaska, Hawaii and many American territories are on the front lines of climate change.
In 2016, a DC-8 loaded with scientific instruments took off from Palmdale, California, ascending through a sky thick with wildfire smoke and smog from nearby Los Angeles.
It was a fitting start to the first leg of the Atmospheric Tomography Mission (ATom), led by Steven C. Wofsy, the Abbott Lawrence Rotch Professor of Atmospheric and Environmental Science at SEAS and the Department of Earth and Planetary Sciences. Since 2016, the ATom mission has made two trips around the world — pole to pole — taking atmospheric measurements to understand how pollution and greenhouse gasses move through the atmosphere.
The ATom mission, in partnership with NASA, will fly a total of four trips around the world. The data it collects will help improve the accuracy of the environmental models that inform climate policies.
That first leg gave the research team a sobering view of the scope of climate change in America and American territories. Several hours after leaving the searing heat and wildfires of California, the team flew over Alaska, where large dark pools of water disrupted what should have been a continuous sheet of white, polar ice.
“The contrast between the environments could not have been more dramatic yet, both places were experiencing huge impacts from the warming climate,” said Wofsy.
And even though no major fires were burning in northern Alaska when the ATom team conducted their first mission, the researchers recorded high levels of pollution from wildfires burning hundreds of miles away, in the forests of Siberia.
“Pollution can be transported anywhere,” said Roisin Commane, research associate in environmental science and engineering at SEAS and member of the ATom team. “We saw pollution thousands of miles from shore, in what should have been some of the cleanest air in the world. We saw pollution from Asia transported over the Pacific Ocean and pollution from the U.S. over the Atlantic. Pollution has no borders.”
Engineering hope
Wofsy and Paul Newman of NASA’s Goddard Space Flight Center sent back a video postcard of the first two legs of their Atmospheric Tomography, or ATom mission. The science team first traveled from Palmdale, California, to Anchorage, Alaksa, by way of the North Pole, and on their second leg flew south to Kona, Hawaii. (Credit: NASA’s Goddard Space flight Center/Michael Randazzo)
These consequences of global warming in the U.S. also know no borders— it affects young and old Americans, East Coast urbanites and Midwestern farmers.
In addition to leading efforts to understand the systems that contribute to a warming planet, researchers at SEAS are also developing new tools and technologies to help reverse, or at least slow, the process. That includes projects aimed at generating clean power and storing it in long-lasting batteries.
Eric Mazur, the Balkanski Professor of Physics and Applied Physics, has researched the properties of nanoscale structures in silicon, which have promising applications to improve the capacity of solar cells. Jennifer Lewis, the Hansjörg Wyss Professor of Biologically Inspired Engineering, has helped develop materials for carbon capture and sequestration.
Professors Michael Aziz, the Gene and Tracy Sykes Professor of Materials and Energy Technologies; and Roy Gordon, the Thomas Dudley Cabot Professor of Chemistry and Professor of Materials Science, are developing non-toxic, long-lasting and cost effective flow batteries to store power from intermittent energy sources, like wind and solar.
SEAS undergraduates are getting involved in the effort as well on Harvard’s campus.
Flow batteries store energy from renewable sources in liquid tanks filled with non-toxic organic chemicals. (Credit: Harvard SEAS)
In an ES96 class, SEAS students worked with the university’s Office for Sustainability to evaluate approaches to climate change resilience and develop strategies to enhance the integrity of the electrical grid, cool buildings during extreme heat, and minimize damage from flooding.
“While we may have dysfunction in Washington, parts of the U.S. are doing serious things about climate change,” said McElroy. “California and New England are shining examples. Mayors of major U.S. cities have been leaders in tackling these issues. So, on the optimistic side, there are signs that people can get together and get things done.”
It’s important not to lose that optimism, said Wofsy.
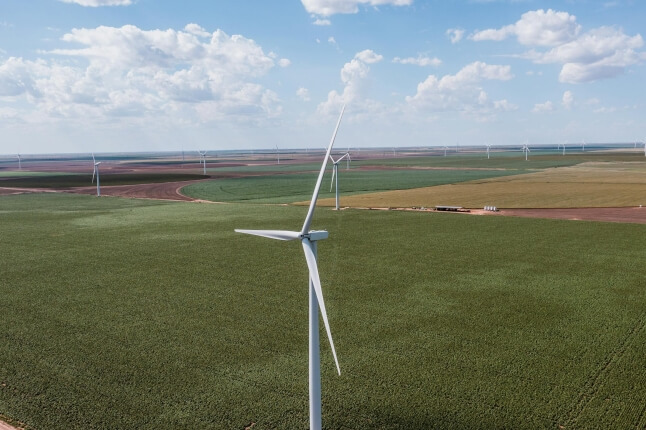
He and the ATom team saw something else on that first flight from California: solar and wind farms generating carbon-free electricity.
“This sight was much more hopeful,” Wofsy said. “If we apply our minds and resources to the problem, we can make significant progress in slowing the increase in atmospheric CO2. But it’s a generational challenge.”
Topics: Climate
Cutting-edge science delivered direct to your inbox.
Join the Harvard SEAS mailing list.
Scientist Profiles
Peter John Huybers
Professor of Earth and Planetary Sciences and of Environmental Science and Engineering
Loretta J. Mickley
Senior Research Fellow in Chemistry-Climate Interactions
Steven C. Wofsy
Abbott Lawrence Rotch Professor of Atmospheric and Environmental Science
Press Contact
Leah Burrows | 617-496-1351 | lburrows@seas.harvard.edu
