News
Students Sophie Hilgard, S.M. '17, (left) and Nikhila Ravi, a visiting student from the U.K., used data analytics to model human dynamic flow throughout the city of Como, Italy. (Photo by Adam Zewe/SEAS Communications.)
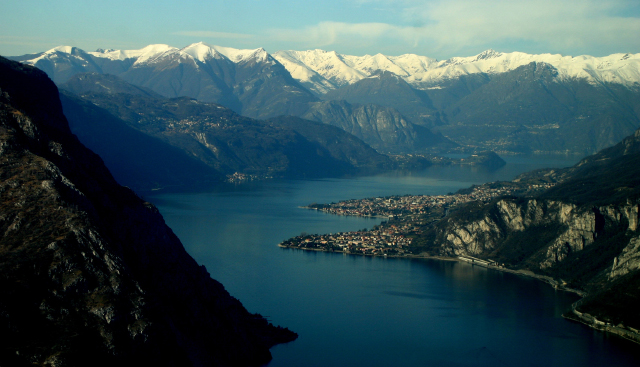
With its 28-mile-long azure lake, framed by the snow-capped Alps, the picturesque city of Como, Italy, is a popular vacation destination for entertainment royalty, including George Clooney, Madonna, and Sting.
Paparazzi keep track of these famous visitors, but how can municipal officials monitor the way the other 1 million tourists who visit Como each year travel among the districts and attractions in this medieval city?
To help Como’s tourism office answer that question, a team of students in Computational Science and Engineering Capstone Project (APCOMP 297R) partnered with Fluxedo, an Italian tech startup, to model human dynamic flow throughout the city by integrating cell phone and social media data analytics.
The students, completing the course as part of the Computational Science and Engineering master’s program, offered by the Institute for Applied Computational Science (IACS) at the Harvard John A. Paulson School of Engineering and Applied Sciences, collaborated with peers at the Italian technical university Politecnico di Milano for their capstone project.
“With so many visitors, municipal officials have a clear motivation to understand how people move through the city, especially tourists,” said Nikhila Ravi, a visiting student from the U.K. “This information could show officials how to use city resources to cater to tourists and, ultimately, provide a better experience for them.”

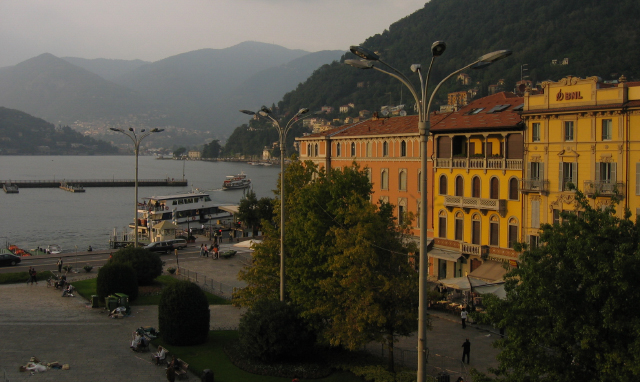
The picturesque city of Como, Italy, draws more than 1 million tourists from around the world each year.
To paint a clearer picture of citywide movement patterns, the students analyzed data from mobile phone connections to nearby wireless towers. They sifted through a massive dataset that included all calls, texts, push notifications, app check-ins, or any other mobile data use recorded within one of 10 city regions.
In collaboration with their Italian teammates, Ravi and Sophie Hilgard, S.M. ’17, used that data to build a model showing where people move within the city over time. Their granular model tracks movements hour-by-hour throughout the year, and also presents heat maps of density in each city region. The data is sorted by mobile phone country code, so users can easily see how international tourists travel, in comparison to locals and visitors from elsewhere in Italy.
To develop a deeper understanding of why certain districts are popular at specific times, the students examined a dataset of TripAdvisor ratings and scraped data from Twitter and Instagram, conducting an analysis of hashtags and studying frequently mentioned locations through the lens of tourist movement and density patterns.
“This data could be useful for the city to know which areas they may want to focus on to most effectively reach the tourists in the city,” Ravi said. “For instance, they can see which areas tourists rarely seem to visit—perhaps there are opportunities to generate additional tourist revenue.”
For the students, who traveled to Como to meet their teammates during spring break, their visit was an eye-opening experience. As they wandered through the medieval streets, they enjoyed seeing some of the destinations they had analyzed, like Mystic Burger, a slightly out-of-place fast food joint with an especially fervent social media fan-base.
Working with the Italian students was a great experience, Hilgard said, since they brought different skills to the table and had a fresh perspective on how to use visual design principles to present detailed information.
The opportunity to visit such a beautiful tourist spot was a highlight for the Harvard students, who also brought home important lessons on the use of data to paint a clear picture of a complex problem.
“Working with so many different datasets was definitely challenging. We had to overcome aggregation issues, problems caused by missing data, and all sorts of other headaches,” Hilgard said. “Being responsible for coming up with solutions ourselves was a great learning experience.”

The results of the students' data analytics project could help tourism officials in Como better utilize city resources to cater to tourists.
Topics: Computer Science
Cutting-edge science delivered direct to your inbox.
Join the Harvard SEAS mailing list.
Press Contact
Adam Zewe | 617-496-5878 | azewe@seas.harvard.edu


